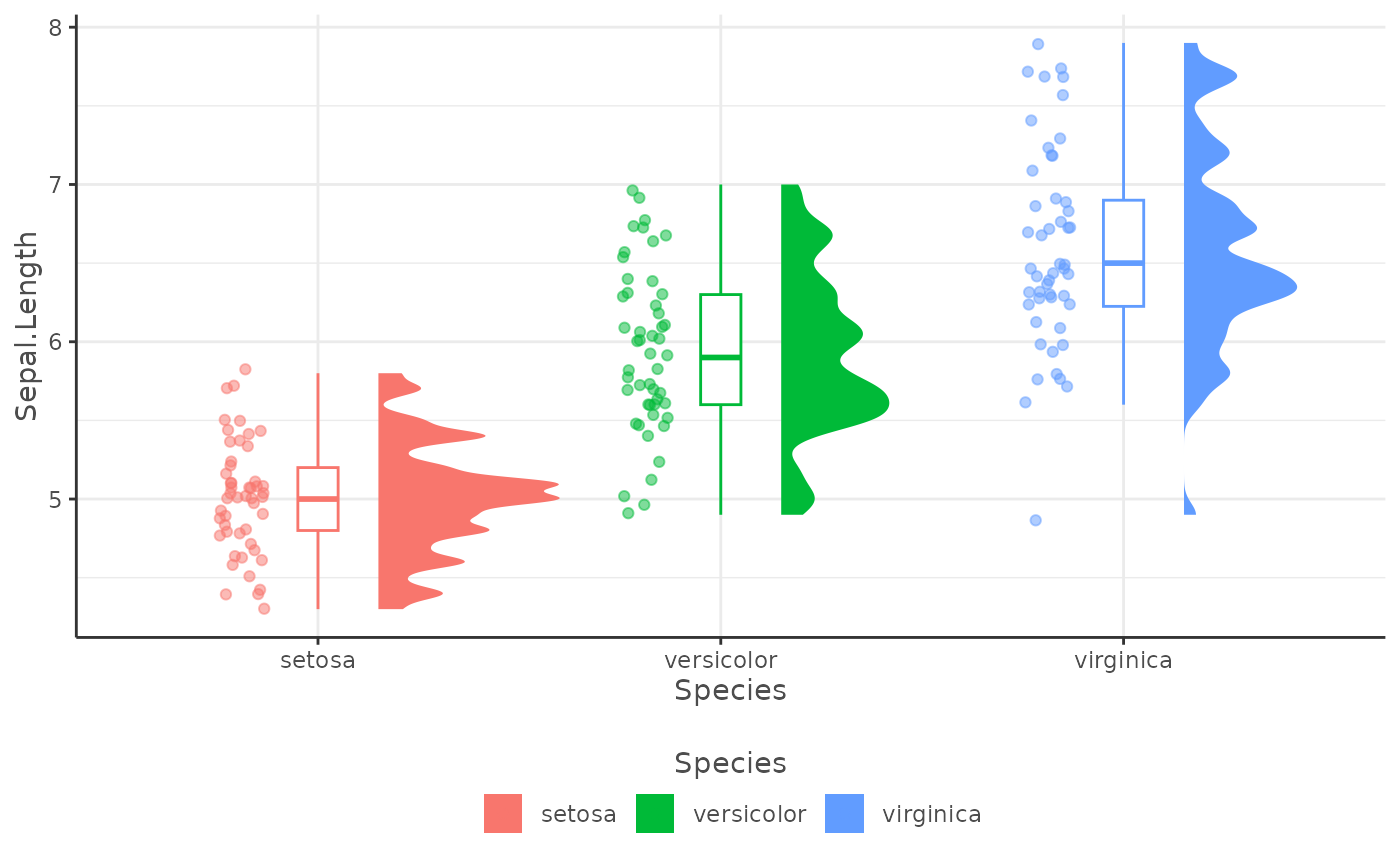
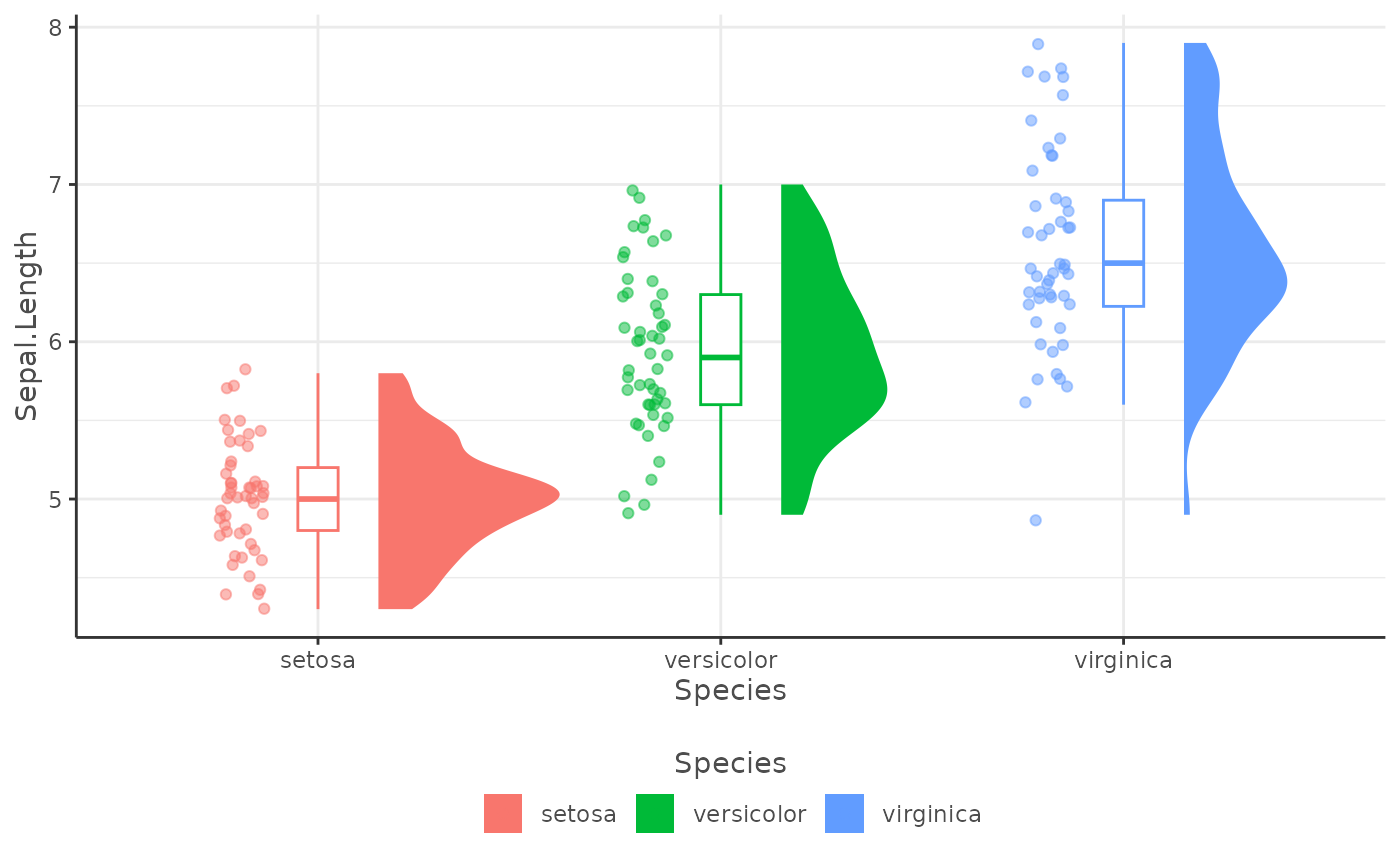
Create a raincloud plot to provide maximal statistical information while preserving the desired ‘inference at a glance’ nature of barplots and other similar visualisation devices.
Arguments
- data
A data frame that includes the grouping and continuous variable.
- grouping_variable
The variable we want to map colours to.
- continuous_variable
The continious variable we want to be displaying the distribution of.
- smoothness
A measure, which must be > 0, representing the smoothness of the density plot (i.e. how closely you want the density to match the distribution). Default is 0.3, but too high values can oversmooth the data, and too low values can cause undersmoothing. Generally it is recommended to stick with values between 0.3-1.